Pricing
When the deliverable asset exists in plentiful supply, or may be freely created, then the price of a future is determined via
arbitrage arguments. The forward price represents the expected future value of the underlying
discounted at the
risk free rate—as any deviation from the theoretical price will afford investors a riskless profit opportunity and should be arbitraged away; see
rational pricing of futures.
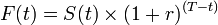
Thus, for a simple, non-dividend paying asset, the value of the future/forward,
F(t), will be found by discounting the present value
S(t) at time
t to maturity
T by the rate of risk-free return
r.
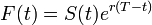
or, with
continuous compounding
This relationship may be modified for storage costs, dividends, dividend yields, and convenience yields.
In a perfect market the relationship between futures and spot prices depends only on the above variables; in practice there are various market imperfections (transaction costs, differential borrowing and lending rates, restrictions on short selling) that prevent complete arbitrage. Thus, the futures price in fact varies within arbitrage boundaries around the theoretical price.
The above relationship, therefore, is typical for stock index futures, treasury bond futures, and futures on physical commodities when they are in supply (e.g. on corn after the harvest). However, when the deliverable commodity is not in plentiful supply or when it does not yet exist, for example on wheat before the harvest or on
Eurodollar Futures or
Federal Funds Rate futures (in which the supposed underlying instrument is to created upon the delivery date), the futures price cannot be fixed by arbitrage. In this scenario there is only one forces setting the price which is simple supply and demand for the future asset as expressed by supply and demand for the futures contract.
In a deep and liquid market, this supply and demand would be expected to balance out at a price which represents an unbiased expectation of the future price of the actual asset and so be given by the simple relationship
. With this pricing rule, a speculator is expected to break even when the futures market fairly prices the deliverable commodity.
In a shallow and illiquid market, or in a market in which large quantities of the deliverable asset have been deliberately withheld from market participants (an illegal action known as a
corner), the market clearing price for the future may still represent the balance between supply and demand but the relationship between this price and the expected future price of the asset can break down.
The above is taken from the
Wikipedia article on futures.


 ).
).