
http://seekingalpha.com/article/244100-when-to-use-a-covered-call-strategy-lessons-from-history
Writing covered calls is likely one of the safest trading strategies to employ. But when is the appropriate time to use this strategy? The Chicago Board Options Exchange created an index to measure the performance of just this strategy, the “buy-write index”, or “BMX”. The BMX tracks a hypothetical strategy that a) buys the SP500 stocks, and b) writes near-term index call options on the SP500 index. While created in 2002, the CBOE reconstructed the index back to 1986 and has made this data available. The performance of the BMX is a good surrogate for how a covered-call strategy would have performed at varying periods of ups and downs in the market.
Intuition: Intuitively, a covered-call strategy should provide additional returns to a simple market-long strategy (e.g. buy and hold the SP500) when the market is range-bound, since the stock will not get called away and the premium will dissolve to zero as time passes to expiration. As well, the strategy should perform better than a buy-and-hold strategy in a falling market, since the original premium of the written options will add some incremental gains to the falling equity positions. But, again intuitively, a covered-call strategy should not perform as well as a buy-and hold strategy in a rising market – the gains on the equities will be capped at the exercise price of the written call option. In this scenario, the trader will be left with the value of the original premium on the written option plus the run-up in the equity price to the strike price of the option.
Empiric Observations: Do these intuitive claims hold water when real data is examined? Let’s track the monthly performance of the SP500 (SPX) and the BMX beginning in July 1986. Overall, the monthly returns for the SPX have averaged +65bps (+8.0% annualized), while the BXM has averaged +79bps (+9.8% annualized). And, the BMX returns were accomplished with lower volatility, 11.2% versus 16.4%, respectively. Interestingly, a study by Callan Associates using data from 1988 to 2006 found similar results, albeit with somewhat higher returns and lower volatility, since the 2008 market crash was not included in this earlier sample.
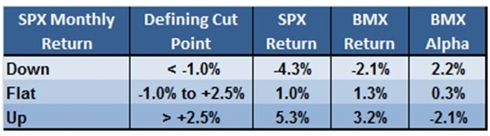
What about when the market is rising, falling, or steady? For the sake of analysis, let’s divide the 293 months in the 1986 – 2010 sample into three groups by SPX returns. As it turns out, monthly return cut points of -1.0% and +2.5% produce similar-sized subgroups (33% of months) of Down, Flat, and Up months. As anticipated, the BMX outperforms the market in Down and Flat months, but underperforms the market in Up months.
Momentum: What happens when we add the variable of “momentum” into the equation? Said another way, how does a covered-call strategy perform in a market that is trending (high momentum) versus choppy (low momentum). For this analysis, the monthly Momentum Factor (“Mom”) of Fama and French is useful. Mom is high when prior high-performing stocks continue to rise and low when there is a reversal and prior low-performing stocks outperform the prior high-performers. BMX performs almost identical to the market when Mom is low (choppy market, alpha = +4bps) or neutral (alpha = -2bps), but outperforms the market when Mom is high (trending market – either up or down, alpha = +38bps).
Putting it All Together: Since the Momentum Factor can be high in a rising or falling market, as long as the market is steadily rising or falling, it may be useful to put these two factors together:
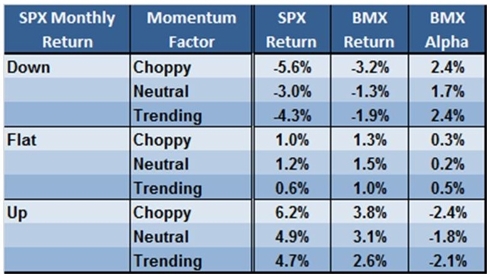
Again, BMX greatly outperforms the market (alpha is positive) when the market is down, modestly outperforms the market when the market is flat, and well-underperforms the market when the market is up. Momentum has a much less striking influence.
In conclusion, intuitions were correct – a covered-call strategy outperforms a buy-and-hold strategy in a down market or flat market, but underperforms buy-and-hold in a rising market. The obvious limitation is that it is impossible to know whether an up market will continue to rise, or whether a down market will continue to fall. Even if we agree that we can’t predict the direction of the market from one month to the next, a covered call strategy has historically yielded almost a 2% incremental annual return, at the same time decreasing volatility by about 30% - equating to an approximate doubling of the Sharpe ratio.